![Top 15 Mobile Gaming Metrics You Must Know for Success [2023]](https://blog.payproglobal.com/hs-fs/hubfs/header_Top-15-Mobile-Gaming-Metrics.webp?noresize&width=730&height=380&name=header_Top-15-Mobile-Gaming-Metrics.webp)
The mobile gaming industry is currently experiencing remarkable growth and is considered one of the most rapidly expanding industries. As of 2021, the estimated revenue generated by mobile gaming was over $90 billion. The rising demand for mobile gaming has made it necessary for developers and marketers to fully comprehend the metrics which determine a mobile game's success.
In this article, we will delve into the top 15 mobile gaming metrics that are critical for achieving success in 2023. These metrics are categorized into four major sections: user acquisition, engagement, monetization, and performance. Gaining a thorough understanding users' behavior through these mobile game metrics and consistently tracking them can help developers who sell Indie games online in making informed decisions to enhance the overall performance of their mobile games.
User Acquisition Metrics
1. Conversion Rate to Install (CR)
What is the Conversion Rate and How to Calculate it
The percentage of users who installed a mobile game after clicking on an ad or landing page is called the conversion rate (CR). It measures how well a marketing strategy persuades people to install the game.
Installs divided by clicks or visits equal CR. So, the CR would be 10% if a marketing campaign generates 1,000 clicks and 100 installs.

Why is it important
CR shows mobile game creators and marketers how well their marketing initiatives drive installs. By tracking CR, businesses can determine which campaigns and ad creatives convert users and then adapt their user acquisition techniques to increase installs.
Strategies to improve your Conversion Rate
Here are a few ways to improve your conversion rate:
Clear and attractive ad creatives can boost conversion rates by explaining the game and why people should install it.
Testing video advertisements, interstitials, and playable ads can help determine which format converts best.
Enhance landing page: A suitable landing page with a clear call to action can boost conversions.
Find your audience: Making sure the ad's message is appropriate to the audience can boost conversions.
2. Click-Through Rate (CTR)
What is Click-Through Rate and How to Calculate it
CTR is a user acquisition metric that measures the percentage of viewers who clicked on an ad. It measures how well an ad draws users to a mobile game's landing page or app store listing.
CTR is computed by dividing ad clicks by impressions or views. For example, CTR is 10% if an ad has 1,000 views and 100 clicks.

Why is it important
CTR helps mobile game creators, and marketers measure how well their advertising attracts users and drives traffic to the game's landing page or app store listing. By tracking CTR, they can optimize user acquisition techniques to increase CTR and game traffic.
Strategies to improve your Click-Through Rate
Clear and interesting ad creatives can enhance CTR by appealing to users and increasing interest in the game.
Testing video advertisements, interstitials, and playable ads can determine which format generates the most clicks.
Targeting the correct audience to ensure users see relevant ads helps boost CTR.
Improving ad placement to increase ad visibility and accessibility to users increases CTR. Create ad copy that addresses user issues, since users are more likely to click on your ad if you emphasize how your game solves their problems.
Retargeting advertisements can enhance CTR by re-engaging people who have expressed interest in the game but have not yet installed it.
3. Retargeting Metrics
What are Retargeting Metrics & How to Calculate them
Retargeting analytics assess how well these campaigns re-engage consumers who have expressed interest in a mobile game but have not yet installed it.
Retargeting campaigns calculate their click-through rate by dividing clicks by impressions.
The conversion rate is the number of installs divided by the number of clicks, and the cost per re-engagement is the entire campaign cost divided by the number of people who re-engaged.
Why are they important
Retargeting data optimizes user acquisition and game performance, and by following retargeting stats, one can effectively determine which campaigns and methods drive installs.
Strategies to improve your Retargeting Metrics
Personalize retargeting advertising to boost click-through and conversion rates.
Retargeting efforts can drive installs by testing multiple ad formats like video, interstitials, and playable ads.
Differentiate your audience by activity and interests to make retargeting advertisements even more relevant and achieve the ultimate goal of improving installs.
Adjust retargeting ad frequency to avoid ad fatigue and increase installs without upsetting users.
Retargeting efforts can improve installs by offering discounts, bonuses, or exclusive content.
Retargeting efforts enhance installs by identifying individuals like those who have already installed the game.
Engagement Metrics To Track
4. Daily Active Users (DAU)
What is DAU and How to Calculate it
Daily Active Users (DAU) quantifies the number of unique engaged users who open and play a mobile game on a daily basis. Basically, its purpose is to measure everyday game usage.

Why is it important
DAU allows mobile game creators and marketers to gauge player engagement and activity. Constantly tracking DAU leads to a better understanding of how the game performs and leads to considerable engagement and retention improvement.
Strategies to improve your DAU in mobile gaming
Increasing the chance of users returning to the game and engaging with it regularly requires optimizing the onboarding experience.
Daily benefits like bonuses, coins, or other in-game purchases encourage players to return and play the game.
Time-limited events like challenges or contests entice players to remain occupied with your game.
Push notifications can be effectively used to encourage daily engagement.
Social features like leaderboards, friend invites, and in-game chat can boost involvement and entice players to play the game.
By regularly adding levels, obstacles, and other content, the game can stay engaging and fun, luring players back repeatedly.
5. Monthly Active Users (MAU)
What is MAU & How to Calculate it
The Monthly Active Users (MAU) metric counts the number of distinct individuals who access and interact with a mobile game on a monthly basis. It gives an indication of the number of players who actively utilize the game over the course of a month.
The number of unique users who opened and played the game on a monthly basis is tallied to determine MAU.

Why is it important
For mobile game companies and marketers, MAU is essential among game metrics since it gives them insight into the size of their user base and how engaged those players are over time. They can spot patterns in user behavior and make wise decisions to increase engagement and retention by monitoring MAU. Additionally, MAU can also be used to assess the game's overall health and the effectiveness of user acquisition strategies.
Strategies to improve your MAU in mobile gaming
Providing a delightful and uninterrupted gaming experience is crucial for ensuring user satisfaction and improving retention rates, as well as increasing monthly active users (MAU). Achieving this requires a well-designed game that is easy to navigate and has an intuitive interface.
Incorporating feedback from users can help identify and address any issues they might encounter during gameplay, perfecting the overall user experience.
Continuously update the game by adding new features that are popular among the target audience. Tracking trends and staying up-to-date with the latest developments in the gaming industry can help identify areas for improvement and generate new ideas for enhancing the game's appeal.
Promote the game on popular platforms that have a similar target audience. This will help increase visibility and generate interest in the game.
Offer rewards such as in-game currency or bonuses to help generate word-of-mouth promotion, ultimately leading to increased MAU.
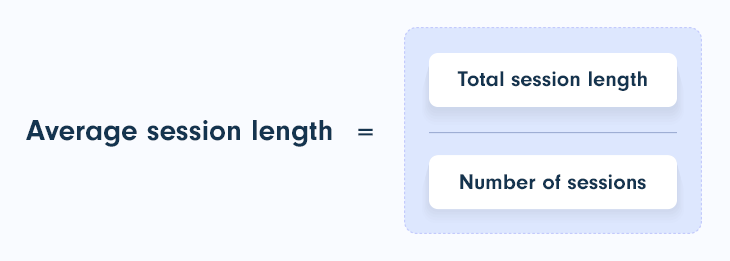
6. Session Length
What is Session Length and How to Calculate it
The mobile gaming business uses session length to assess user engagement because it indicates user interest in the game. A mobile game's session length should be measured from start to finish to obtain the correct data.
Why is it important
Mobile game developers and marketers need session length to gauge user engagement and interest. They can optimize retention by tracking session length to determine which features and gameplay elements are most engaging.
Furthermore, developers and marketers can duplicate extended session times by studying session length data. Tracking session length can also assess user acquisition and game health.
Strategies to improve your Session Length in mobile gaming
Consider enhancing game mechanics since adding more intriguing and challenging gaming features helps keep users engaged and improves session length.
Tutorials and guides help players comprehend the game's plot, therefore playing longer.
Optimize gameplay and load times to heighten user experience and session length.
Extra rewards or in-game currency for longer sessions can encourage players to play longer.
7. Retention Rate
What is the Retention Rate, and How to Calculate it
Retention rate is an engagement indicator that quantifies the percentage of users who keep playing a mobile game after a set time. This is commonly defined as one, seven, or thirty days and tracks long-term users.
Mobile game developers divide the number of users that installed and played the game on a given day to calculate the retention rate.

Why is it important
Mobile game developers and marketers use the retention rate to determine how engaged their clients are over time. They can understand user behavior trends and make wise decisions to boost engagement and retention by tracking retention.
Mobile game developers and marketers can use retention rate data to uncover tactics that increase retention and reproduce them in future upgrades and games. Tracking retention rates can also help evaluate user acquisition and game health.
Strategies to improve your Retention in mobile gaming
Personalized onboarding improves game mechanics and retention.
Rewarding players with bonuses, coins, or other in-game currency helps increase retention. Time-limited events like challenges or competitions also enhance game retention.
New levels, challenges, and goods can keep the game fresh and expand player engagement.
Reducing load times and maintaining seamless gameplay can improve user experience and retention by minimizing annoyance and encouraging play.
8. Churn Rate
What is the Churn Rate and How to Calculate it
The percentage of users that cease playing a mobile game over a given period is measured using the churn rate.
The number of users who stopped playing the game during a specific period is divided by the overall number of active players during the same period to determine the churn rate.

Why is it important
Because it reveals how involved and interested consumers are in the game over time, the churn rate is a crucial indicator for mobile game developers and marketers. Identifying patterns in user behavior allows them to make wise decisions to increase engagement and retention by monitoring the churn rate.
By understanding churn rate data, developers and marketers can address variables that lead to high rates in upcoming updates or new games. Monitoring the churn rate can also determine the game's general health and the effectiveness of user acquisition strategies.
Strategies to improve your Churn Rate in mobile gaming
Retainment campaigns that use individualized messaging help re-engage players who have left the game.
Win-back campaigns that reward bonuses, coins, or other in-game cash encourages players to return to the game and lower churn.
Addressing problems, speeding up load times, and assuring fluid gaming improves the user experience and decreases churn.
Monitoring user comments and responding to problems and issues enhances the user experience and lowers turnover.
Providing incentives for continuous play, such as bonuses, coins, or other in-game currency, encourages users to stick with the game and decreases churn.
Monetization Metrics You Need To Know
9. Lifetime Value (LTV)
What is LTV and How to Calculate it
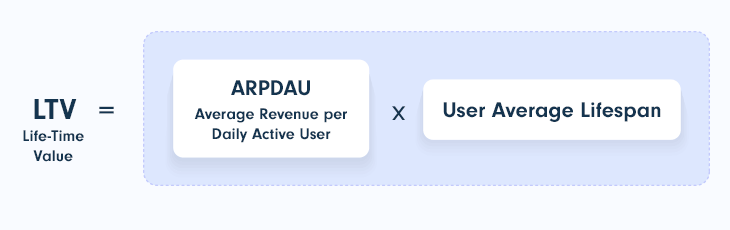
The lifetime value (LTV) indicator is an important parameter for mobile game developers and marketers. It enables them to make an educated guess of how much money an individual user will likely create throughout their gameplay.
LTV is determined by calculating the average user lifetime by average revenue per user (ARPU). By monitoring LTV, developers, and marketers may learn which players are the most valuable to the game and spot areas where user recruitment and retention strategies must be strengthened.
Why is it important
For game marketers and developers, LTV offers a data-driven decision-making process. They may choose wisely which user demographics to target in marketing efforts and how much money to spend on recruiting new customers by evaluating LTV. LTV can also be used to find game-improvement options to increase revenue and player retention. This could entail expanding the number of in-app transactions or enhancing the user interface.
Strategies to improve your LTV in mobile gaming
Boosting user retention can be accomplished by designing enjoyable gameplay, providing rewards for recurring players, and routinely adding new content to the game.
Virtual currency, power-ups, and other in-app purchases can raise the revenue generated per user and, as a result, their LTV.
Fixing problems, speeding up load times, and ensuring fluid gaming can enhance the user experience and increase LTV by getting players more involved in the game.
Premium content or feature-rich subscription models can expand income earned per user and, consequently, their LTV. This technique may be an efficient way to retain user interest while generating a steady cash stream.
10. Conversion Rate to Paying Users
What is Conversion Rate to Paying Users, and How to Calculate it
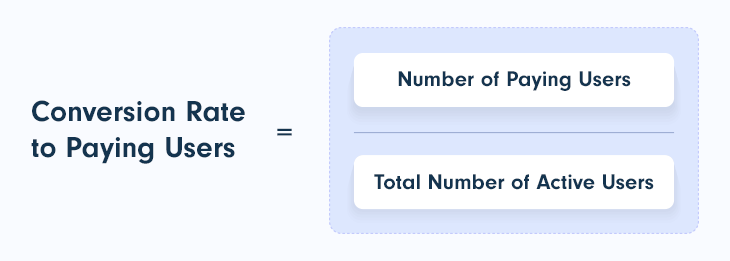
The measurement of Conversion Rate to Paying Users is a significant monetization metric in the mobile game industry, as it encapsulates the percentage of users who execute a purchase within the context of a mobile game. It denotes the degree of success in converting users into paying users.
The process of calculating the Conversion Rate to Paying Users is calculated by dividing the number of paying users by the total number of active users within a specified time frame.
Why is it important
This enables developers and marketers to ascertain the efficacy of their monetization tactics, thereby facilitating the identification of the best strategies for converting users to paying users. By leveraging this information, they can make informed decisions aimed at optimizing their monetization tactics, leading to a positive impact on their overall revenue.
Strategies to improve your Conversion Rate to Paying Users in mobile gaming
Users' likelihood to purchase can grow with payment process simplification and efficiency.
Developers can boost sales using data to customize the in-app purchase options.
Developers can find the best pricing structure by testing various price points and examining user behavior to optimize income while maintaining customer attractiveness.
Fixing problems, accelerating load times, and guaranteeing fluid gaming can amplify user engagement and increase the probability that consumers will purchase.
Offering subscription models with premium content or features can strengthen the likelihood of customers completing a purchase.
11. Average Revenue Per Paying User (ARPPU)
What is ARPU and How to Calculate it
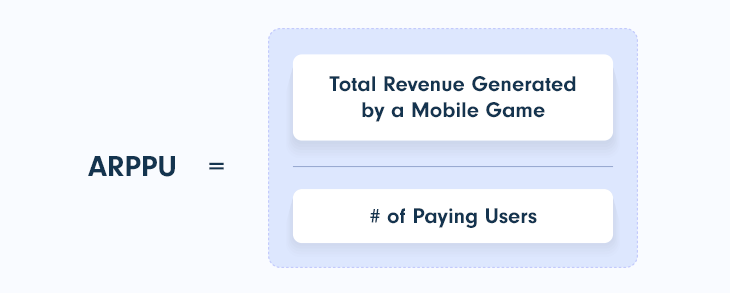
One key metric for measuring monetization performance in the mobile game industry is the Average Revenue Per Paying User (ARPPU). ARPPU is a major indicator of how much revenue is generated on average by each paying user of a mobile game.
To calculate ARPPU, the total revenue generated by a mobile game is divided by the number of paying users during a given period. This allows developers and marketers to track changes on the average revenue each paying user generates over time.
Why is it important
ARPPU is a vital metric for mobile game developers and marketers because it provides insight into the revenue-generating potential of each paying user. By analyzing ARPPU trends, they can identify user behavior patterns and make data-driven decisions to advance monetization strategies.
Furthermore, tracking ARPPU helps developers and marketers to determine the effectiveness of different pricing strategies and in-app purchase offerings. By comparing ARPPU across different cohorts or periods, they can gain insights into how various factors, such as promotional activities, pricing changes, or content updates, impact overall revenue generation.
Strategies to improve your ARPU in mobile gaming
Using adverts to monetize a mobile game can boost income earned per paying user as long as they do not negatively affect the user experience.
The likelihood that paying customers will make purchases can be increased by personalizing offers based on user behavior and preferences, which will improve revenue per paying user.
Sales and limited-time offers can encourage paying customers to make purchases and raise revenue per paying customer.
Social elements like leaderboards, friend requests, and in-game chat can elevate user interaction and motivate paying customers to make purchases, increasing revenue per paying customer.
12. In-App Purchases (IAP)
What is IAP and How to Calculate it
Users can buy virtual items, services, or currency with real money inside the app through in-app purchases (IAPs), a common monetization model used in mobile gaming and other apps. The strategy enables app developers to monetize their apps and make money without relying entirely on adverts or in-app purchases.
IAP is often calculated by developers considering the overall number of purchases users have made within the app, the average dollar amount spent on each purchase, and the proportion of users who have made purchases. For instance, the IAP would be $5,000 if an app had 10,000 users and 1,000 of them made purchases at the cost of $5 each.

Why is it important
IAP is essential for creating mobile games and apps since it offers a consistent income stream that can cover ongoing costs for development and upkeep. Providing worthwhile virtual goods and experiences can enhance user engagement and retention.
Strategies to improve your IAP in mobile gaming
Consider including limited-time discounts and promotions.
Create exclusive in-game content that can only be obtained through purchases and behavioral analytics. This will help to better understand user behavior and preferences to customize IAP offers.
Allow players to advance in the game without using IAP while offering enticing rewards for those who decide to purchase.
Provide clear and accurate pricing information, emphasizing benefits to ensure that users understand the value of their purchase and are confident in their decision to buy.
Performance Metrics
13. App Load Time
What is App Load Time and How to Calculate it
An app's load time is a compelling parameter that affects user experience, engagement, and retention. You can use the following formula to calculate app load time:
App Load Time = Time when the app is fully loaded - Time when the app is launched
However, for accurate results, developers can use Google Lighthouse to calculate app load time. Additionally, Google Play and Apple's App Store provide performance metrics for developers.
Why is it important
App load time impacts user retention and engagement. Faster load times increase engagement and satisfaction and decrease app abandonment.
Strategies to improve your app load time
Optimizing photos, videos, and other media can reduce file size and improve app load time.
A content delivery network (CDN) can minimize load times for consumers in different locations by caching and distributing content across numerous servers.
Optimizing server-side code and database queries can also speed up app load time. Developers should constantly test and analyze app load time to discover and fix issues asap.
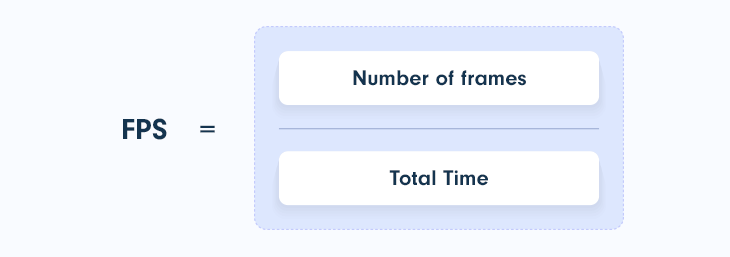
14. Frame Rate
What is Frame Rate and How to Calculate it
The number of frames or images displayed per second in a video game or other graphical program is an important metric called frame rate.. The user experience, gameplay, and immersion can all be significantly impacted by frame rate, which is commonly measured in frames per second (FPS).
The frame rate can be calculated by developers using various methods, including built-in performance indicators in game engines or graphics profiling software. They can also employ third-party applications or in-game console commands to display real-time frame rate data.
Why is it important
Because it can impact user experience and engagement, the frame rate is critical. Lower frame rates can result in latency, stuttering, and other performance problems that can harm the user experience. In contrast, higher frame rates can result in more fluid and responsive gameplay.
Strategies to improve your Frame Rate
Adjusting graphics settings can increase the frame rate while lessening the load on the system. To reduce processing overhead, decrease the number of items and effects on the screen.
Reducing the amount of configuration that needs to be done helps increase the frame rate by adopting effective rendering techniques like occlusion culling and level of detail (LOD).
Developers can also increase hardware performance by replacing outdated CPUs, graphics cards, and other hardware parts.
Using dynamic resolution scaling to instantly change the game's resolution based on performance requirements will also improve your frame rate.
15. Crashes
What are Crashes and How to Calculate them
Crashes are sudden app shutdowns or malfunctions caused by programming flaws, memory leaks, and hardware problems.
Developers should check crash reporting software to calculate crashes by kind, frequency, and reason. Google Play and Apple's App Store provide performance metrics for developers.
Why are they important
Crashes can severely affect user experience, engagement, and retention, frustrating users, diminishing ratings, and lowering user acquisition and income. So constantly tracking and optimizing this metric should be proactively monitored.
Strategies to improve your Crash Rate
Testing and debugging programs periodically can help find programming problems and memory leaks. We suggest using manual, automated, and CI/CD pipelines to accomplish this task.
Monitor app performance and user feedback to detect and fix crash issues swiftly. Crash reporting, user feedback, and app analytics platforms all help.
Analytics tools can assist developers in investigating user behavior and crash causes. This can help developers prioritize app stability improvements.
Improve crash rate by making apps compatible with various devices and operating systems.
Prioritizing crash issues and dedicating resources to remedy them quickly improves the crash rate. This may require a crash team, a bug-tracking system, and clear communication routes.
Thrive with the industry’s most innovative all-in-one SaaS & Digital Goods solution. From high-performing payment and analytics tools to complete tax management, as well as subscription & billing handling, PayPro Global is ready to scale your SaaS.
Sell your SaaS globally with PayPro Global!
How Can PayPro Global Help?
PayPro Global is a trustworthy Merchant of Record solution that helps SaaS, software, and digital goods developers expand globally. Our comprehensive platform encompasses tax administration, worldwide payments, fraud protection, and compliance, which are important considerations to your business's success in this competitive field. Using our solution, you are able to build a monetization strategy capable of driving rapid worldwide growth.
We value accurate, current data at PayPro Global. We give our clients real-time, sophisticated reporting and analytics capabilities. These technologies give developers global and micro views of their business, in-depth data, and insights to optimize marketing and sales and allocate resources. With access to innovative game analytics tools reviewing user activity, we help businesses increase the number of active and loyal users.
We believe information is essential to company success. Developers can satisfy consumer needs by constantly testing performance and using this data to customize client interactions. Our platform helps organizations use data to boost customer satisfaction and revenue.
Final Thoughts
Metrics for mobile gaming are the key to comprehending and improving the performance of mobile games. Developers need to measure and analyze critical mobile game analytics like LTV, ARPU, app load time, frame rate, and others to improve their games' user experiences, win new users, ensure high user engagement and retention, and, most importantly, drive income.
Additionally, creators should take advantage of various methods and tools to spot problems with these KPIs, fix them, and keep improving the functionality and quality of their mobile games. To stay competitive and provide customers with top-notch mobile gaming experiences, paying attention to these indicators will become more crucial as the mobile gaming market expands.
FAQ
What is KPI for mobile gaming?
Mobile game KPIs help measure and improve performance. The game's KPIs are LTV, ARPU, app load time, frame rate, and crashes. Developers should aim to learn about user behavior and engagement and find areas for development by monitoring and analyzing these metrics.
LTV and ARPU will help developers understand user value and revenue per paying user, respectively. App load speed and frame rate affect user experience and engagement, while crashes frustrate users and lower retention.

Meir Amzallag
Meir Amzallag is the CEO and Co-Founder of PayPro Global, a leading e-commerce solutions provider for software, SaaS, and digital goods businesses. He is also the Co-Founder of Hocoos, the AI-powered website builder. As a thought leader in online commerce, he offers valuable insights and expertise through his writing, focusing on online payment processing, global tax compliance, subscription management, and the evolving landscape of AI-driven web development. Outside of his professional endeavors, he enjoys spending quality time with his family and pursuing his passion for photography.