Confronted with ever-increasing levels of competition, it’s more important than ever for SaaS startups to meticulously track their business performance.
Monitoring key metrics such as churn rate, lifetime value, and customer-acquisition costs will help determine your business's growth rate, boost customer satisfaction, and drive a shared purpose across your organization, not to mention staying ahead of any indications of trouble.
Many metrics, however, should not be measured on their own but assessed against other similar-sized SaaS businesses operating in the same space for a full context.
The 4 Reasons Why Measuring Metrics with SaaS Benchmarks Matters
SaaS metrics lay the groundwork for any successful SaaS company growth strategy, so keeping an eye on them makes perfect business sense. Here are the top four reasons you need to consistently measure them at regular intervals:
1. Keep track of changes:
Every SaaS business needs to keep in touch with how their organization and industry evolve. Measuring and capitalizing on these crucial metrics allows you to easily track changes, ensures high growth and provides a clear view of risks and opportunities.
2. Maximize growth, and minimize expenses:
With an in-depth understanding of the critical metrics to measure your business's success, you can develop a model that supports swift growth and long-term profitability.
3. Measure your success:
Monitoring these metrics is crucial in measuring your progress and determining whether you will likely meet your goals. If you're not hitting the mark, your metrics will guide you to critical focus areas to avoid any disasters.
3. Set meaningful targets:
While targets set too low will hinder your business from achieving its full potential, those that are unrealistically high will probably negatively impact team morale. By using appropriate industry benchmarks, you can set ambitious but attainable targets, as well as make key decisions.
When faced with a seemingly endless list of metrics, you must be particularly discerning when deciding which to track. To help get you started, we've compiled a list of the top metrics to monitor and measure.
Thrive with the industry’s most innovative all-in-one SaaS & Digital Goods solution. From high-performing payment and analytics tools to complete tax management, as well as subscription & billing handling, PayPro Global is ready to scale your SaaS.
Sell your SaaS globally with PayPro Global!
11 SaaS Metrics with Benchmarks
1. Customer Acquisition Costs (CAC)
Definition
CAC measures the cost of acquiring new customers against sales and marketing spending and how long it will take you to recoup that investment.
Reasons to track CAC
Calculating CAC is an important task as it helps to:
Determine the economic viability of your business
Decide whether you need to adjust your sales and customer acquisition costs
Understand if you need djust your growth strategies based on real-time data
Assess the success of acquiring customers.
Read our complete CAC calculation guide to better understand this essential SaaS metric and how to calculate the CAC payback period.
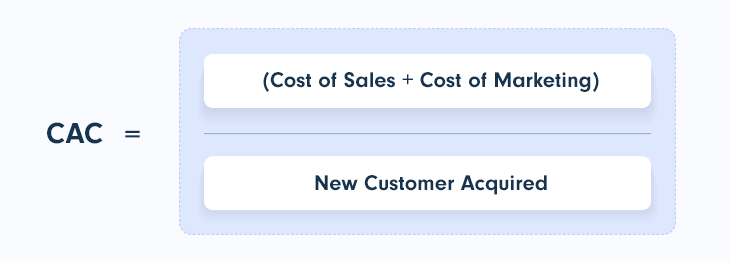
Calculating CAC:
CAC = (sales costs + marketing costs) / new customers
CAC will vary depending on your industry, the growth stage of your business, and your customer segment. To give you some perspective - for an eCommerce business, it can range from $21 to $533. For a B2B SaaS business, the average CAC is roughly $200.
2. Lifetime Value (LTV)
Definition
LTV is a key SaaS metric that helps analyze how much income, on average, your customers contribute to your business throughout their relationship with you.
Reasons to track LTV
LTV helps determine:
Determine how much you should spend to acquire new customers
Pinpoint which customer segment generates the highest revenue over their lifetime
Identify the impact of different retention strategies applied.
You aim to ensure your LTV is more significant than your CAC because, obviously, you don't want to spend more money acquiring customers than the overall value they bring to your business.
Calculating LTV:
To measure LTV, you'll need to have your churn rate or average revenue per user (ARPU) metrics on hand, both of which will be considered in more detail later.
LTV = ARPU × customer lifetime
or
LTV = ARPU / user churn
The benchmark for a good LTV: CAC ratio is 3:1. In other words, to ensure your business remains profitable, LTV should be 3 times higher than acquisition costs.
3. Average Revenue Per User (ARPU)
Definition
ARPU(Average Revenue Per User) is the key SaaS metric meant to calculate the revenue each of your subscribers generates over a given period.
This is an especially beneficial metric for SaaS businesses that allow subscriber upgrades and feature add-ons.
Reasons to track ARPU
Tracking your ARPU will help you:
Evaluate your growth by determining how much revenue each customer brings over a given period
Segment your user base on revenue-distinctive groups
Measure financial performance.
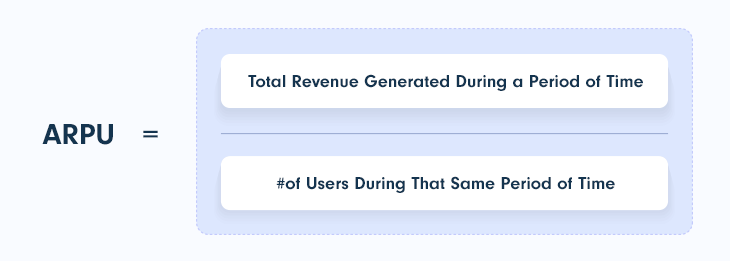
Calculating ARPU
To calculate ARPU, you will need to divide the amount of revenue generated over a given period by the number of users in that same period.
ARPU = total revenue during a specific period/number of active users during that same period
As with CAC, there is no standard benchmark for ARPU as it varies broadly depending on location, industry, customer segment, and pricing model. So, it’s not particularly relevant to look at other businesses.
However, the ARPU of your business is a significant indicator of your success in product development, sales and marketing efficiency.
4. Churn Rate
Definition
An essential SaaS and B2B metric, the churn rate looks at the percentage of customers or subscribers that cancel their subscription to your product or service over a given period.
Coming in different forms, voluntary and involuntary churn, revenue and customer churn, and so on, this metric is highly complex and requires constant monitoring.
Reasons to track Churn
Determining your customer or revenue churn rate will help you:
Gauge the strength of your current business model
Identify if you are practicing the right price
Understand how satisfied your customers are and if you are marketing your product to the right audience
Have robust payment systems in place
Better analyze your product and its features
A high rate of customers that unsubscribe, downgrade their plans, or don't renew can seriously impact your recurring revenue and, therefore, your growth plans.
Retaining your existing customers while acquiring new ones should be a top priority, so keeping track of your churn rate is a good way to monitor the flow of your buyers.
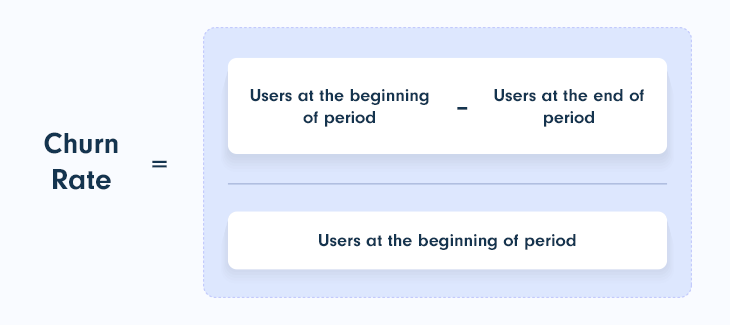
Calculating churn rate
Customer churn rate (%) = (number of customers lost in a period / total number of customers at the start of period) X 100
and
Revenue churn rate (%) = (monthly recurring revenue lost in last 30 days / monthly recurring revenue 30 days ago) X100
Well-established, mature SaaS businesses should aim for an annual churn rate of 5-7%. While early-stage startups and those targeting small to mid-size businesses should expect a monthly churn rate of roughly 5%, which they’ll want to aim to improve over time.
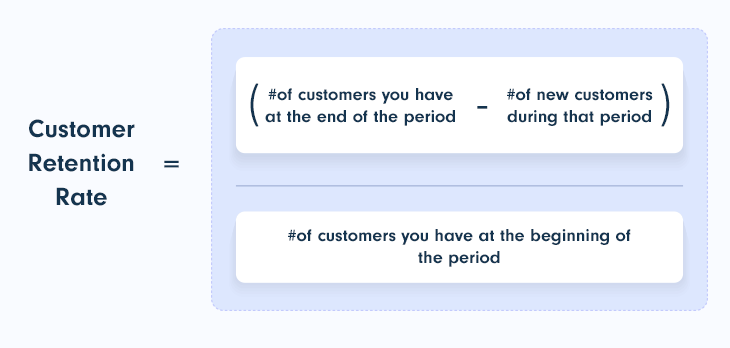
5. Customer Retention Rate (CRR)
Definition
CRR refers to the percentage of customers who opt to renew their contract with you over a given period.
Knowing your retention rate could send the alarm about low customer satisfaction and the need to boost loyalty if necessary. A high CRR, on the other hand, means your business is doing well and you have a satisfied and engaged user base.
Reasons to track CRR
Measuring your CRR helps:
Determine whether your current business strategy works
Provides insight into how your customers relate to your product or service
Better plan future revenue spend.
Calculating CRR
CRR = (number of customers at the end of the period – number of new customers during the period) / number of customers at the beginning of the period) X 100
For a SaaS business, a CRR of 35% or more is considered good. However, be sure to also consider average industry-specific rates.
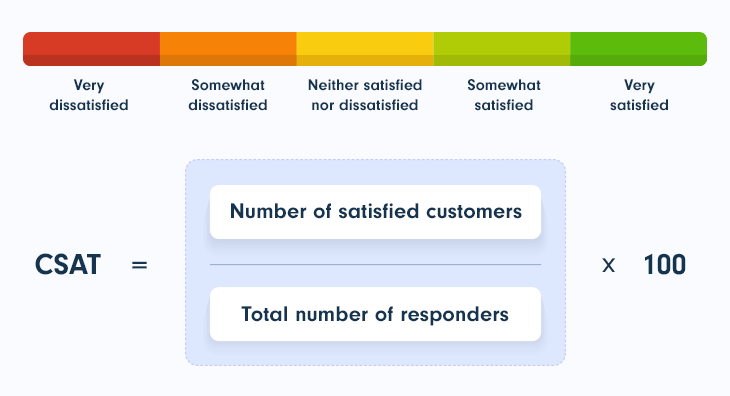
6. Customer Satisfaction Score (CSAT)
Definition
To determine whether your customers are satisfied with your business, your products or services, or any other aspect of the customer journey, you should closely monitor your CSAT.
This SaaS metric tells you how happy your users are with the services or products you are offering.
You can measure this metric through a generic CSAT survey, or you could opt to hone in on specific customer touchpoints such as billing, support, product features, sales interactions, and so on.
Reasons to track CSAT
With the help of this metric, you will be able to:
Measure customer satisfaction levels
Identify areas within your business that need improvement and areas where you excel in your customer relationships
Enhance customer loyalty levels
Obtain feedback on your product development efforts.
It’s widely understood that happy customers lead to brand loyalty and repeat business, as well as positive reviews and referrals, so focusing on this metric ensures you don't lose out on any potential recurring revenue.
Calculating CSAT:
CSAT (for Likert scale questions) = (number of satisfied customers/number of survey responses) X 100
CSAT (for binary questions) = (number of “yes” responses / total number of responses) X 100
In order to understand further, you should know that a great CSAT score is considered to be above 80%.
7. Time to Value (TTV)
Definition
TTV refers to the time it takes for new customers to gain value from the product or service they have paid for. One approach would be to take a general approach to measure overall TTV.
Depending on your SaaS offering, you could measure areas such as time to onboard customers, time to upgrade, time to new feature adoption, and anything else you feel is relevant to your business plans.
Reasons to track TTV
It's essential to monitor this metric carefully, as it could be the difference between loyal, happy customers who renew their business with you and customers leaving you for your competition.
But specifically, you should track TTV as it can help:
Position your brand as a more attractive offering on the market
Evaluate the onboarding process to understand if improvements could be made
Track product efficiency.
Calculating TTV
TTV = date of product/service selection date – date of initial value realization

There aren’t any clear benchmarks for TTV, but be sure to compare your TTV with that of your competition. The lower it is, the better for your business.
8. Natural Rate of Growth (NRG)
Definition
This metric measures any growth independent of your sales and marketing strategy. It focuses on product- or service-led growth that's completely organic, and that's based on your company's value proposition for customers. The benefits of a good NRG include loyal customers and a lower CAC.
Reasons to track NRG
By religiously tracking this metric, SaaS companies can:
Gauge how well a product is at winning and retaining users
Get a better understanding of CAC expenses and ways to improve these costs
Track the growth rhythms of user bases.
Calculating NRG
To calculate your NRG, you'll need to know your annual growth rate, the percentage of organic product/service customer signups, and the percentage of annual recurring revenue that originates from users who’ve already started using the product, i.e., via a free trial, free product, or freemium version.
NRG = (annual ARR growth rate) X (% organic signups) X (% ARR from products) X 100

The benchmark for NRG is dependent on your ARR. A company with between $1 million and $10 million ARR should aim for +50% NRG, while a company earning between $10 million and $50 million ARR should aim for +30%. Those earning over $50 million ARR should aim for +15% NRG.
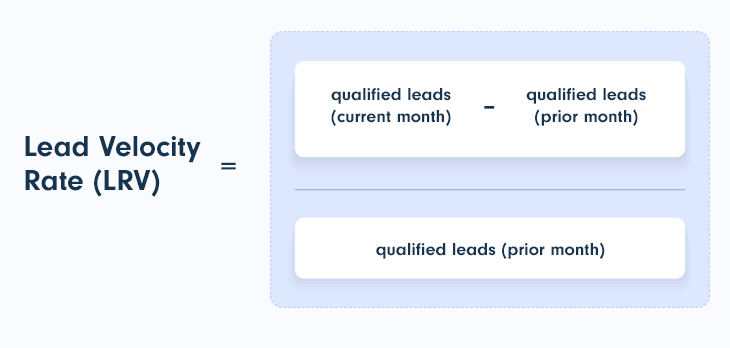
9. Lead Velocity Rate (LVR)
Definition
LVR is a marketing metric that measures month-over-month growth in qualified leads and can help determine whether you're likely to meet your end-of-quarter or end-of-year growth and revenue goals. It helps establish whether your marketing efforts are working and allows you to strategize and set future targets that drive lead generation.
Reasons to track LVR
A forward-looking metric, LVR can help you:
Assess and set internal benchmarks
Predict and plan for future growth.
Calculating LRV
LVR % = (number of qualified leads in the current month – number of qualified leads in the prior month) / number of qualified leads in the prior month) X 100
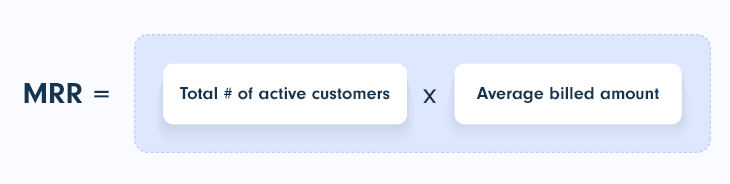
10. Monthly Recurring Revenue (MRR)
Definition
This is a powerful SaaS metric to track your business's growth momentum. MRR measures your monthly revenue flow based on new sales, upsells, and renewed business. With a clear sight of your predictable monthly revenue, you can also strategize your short-term growth path.
As a crucial part of reporting for investor-backed companies, MRR can be measured as a whole or broken down into segments such as new business MRR and churned MRR for more in-depth insight into the overall health of your business. To get a better understanding of this metric, read our MRR guide.
Reasons to track MRR
Constantly monitoring your company’s MRR is important for the health of your business because it allows you to:
Measure your SaaS’s monthly revenue
Better understand your brand’s growth trajectory
Gauge the impact of your churn rate on the profitability of your business
Calculating MRR
Calculating MRR growth rate:
MRR = ARPU X number of subscribers
MRR growth rate (%) = (MRR of month B – MRR of month A) / MRR of month A) X 100
The MRR growth-rate benchmark you aim for should be based on the growth stage of your business. Startups should aim for 15-20%, but SaaS companies, in general, should have a 10-15% MRR growth rate.
11. Annual Recurring Revenue (ARR)
Definition
Like MRR, ARR tracks revenue flow from new sales, renewals, and upsells, however, with a long-term outlook on opportunities and growth potential.
Reasons to track ARR
Understanding your ARR is necessary to:
Properly assess your company's financial health and then make the necessary budgetary adjustments
Forecast revenue and cash flow
Attract potential investors.
Calculating ARR
ARR = revenue from yearly subscriptions + expansion revenue (from add-ons, upgrades) - revenue lost due to churning
ARR growth YoY % = (current ARR - ARR over previous 12 months) / ARR over previous 12 months) X 100
You’ll want to benchmark your ARR growth rate against companies at a similar growth stage to gauge what you should be aiming for. Companies with an ARR less than $1 million should show an average of 68% YoY ARR growth, while companies with an ARR between $3-$5 million should show an average of 35% growth.
5 Ways of Improving Your SaaS Results
1. Improve Your CAC with Product Analytics
High-spend customers engaged and satisfied with your product are one of your most valuable sources of revenue. Using analytics to determine the top sources for these customers will help you adjust your marketing budget accordingly to recoup your marketing investment faster.
2. Maintain a High CSAT Score with Seamless Onboarding
Ensuring a high-quality onboarding experience should always be a top priority, as it can directly impact your CSAT score and your CRR. Be sure to create a personalized user experience that tracks essential milestones as well as easy-to-follow multimedia and in-app elements that guide users through the process.
3. Boost MRR Through Upsells
In-app prompts motivate users to purchase upgrades, and these additional features can help boost revenue. Pop-ups work well to achieve this, highlighting the benefits of more feature-rich plans and packages. Timing is critical when it comes to upsells, so make sure you're not constantly disrupting users' workflow. Driving upsells will help improve CAC, reduce churn, and improve your MRR growth rate.
Thrive with the industry’s most innovative all-in-one SaaS & Digital Goods solution. From high-performing payment and analytics tools to complete tax management, as well as subscription & billing handling, PayPro Global is ready to scale your SaaS.
Sell your SaaS globally with PayPro Global!
4. Reduce Churn With a Self-Service Support System
Most customers across industries prefer self-service and will usually attempt to troubleshoot any issues themselves before reaching out for live assistance. This also applies to SaaS businesses, with round-the-clock access to a self-service support system key to keeping customers happy. This could mean a simple FAQ section or a more complex multimedia knowledge base with best-practice tips.
5. Use The Freemium Model to Improve Conversion Rates
Lastly, provide a free trial of your product or a free basic plan with restricted features, allowing customers to test your offering before they commit to it. This will help you secure more product-qualified leads that could ultimately boost your customer conversion rate and recurring revenue.
How Can PayPro Global Help?
Packed with all relevant revenue growth tools, PayPro Global offers its users robust reporting and analytics to ensure SaaS companies, including horizontal and vertical SaaS, regardless of their growth stage, can have a macro and micro view of their business in real-time.
With access to relevant information, SaaS developers can check and adapt their marketing strategy based on live data. You can verify the performance of your ongoing campaign and optimize it to ensure the best results while limiting the SaaS risk.
Plus, by making use of historical data, you can create personalized campaigns, ensuring increased sales in new markets. You can also decide which pricing strategy is best for your business. From freemium to usage-based billing, PayPro Global's robust infrastructure can handle different models to allow you to obtain the best results.
Closing Thoughts on SaaS Metrics and Improving Your Performance
Measuring the right metrics will help you benchmark your performance against your competition, determine where your company is in its development plan, and adjust your growth path as needed.
Partnering with an expert in SaaS metrics and business intelligence is a great way to elevate your strategy in identifying factors to facilitate rapid growth for your company. With PayPro Global, you can monitor the health of your business and react swiftly to customer and market trends.
Visit PayPro Global or reach out to discuss how we can help you stay on top of your SaaS sales and overall performance. We would love to hear from you and see how we can work together to take your business to the next level.
The most significant cause of churn is when customers are not receiving enough value from the product or service to justify the expense.
Infrequent login or usage, requests for refunds due to changes in billing, dissatisfaction with product updates, and lack of loyalty benefits--all are sure signs that customers are unhappy.

Ioana Grigorescu
Ioana Grigorescu is PayPro Global's Content Manager, focused on creating strategic writing pieces for SaaS, B2B, and technology companies. With a background that combines Languages and Translation Studies with Political Sciences, she's skilled in analyzing, creating, and communicating impactful content. She excels at developing content strategies, producing diverse marketing materials, and ensuring content effectiveness. Beyond her work, she enjoys exploring design with Figma.